QGIS: Beaverpond pH
One morning, I took a long hike through the Credit River lowlands along Culham Trail. I walked off of my usual path and found myself in a wide-open swath of floodplain. I continued along the river and discovered a small creek. In the creek, a small beaver took a quick glance at me before diving under to hide.
I investigated a little bit further and discovered several trees it had gnawed down, and even found where it had made its little lodge. It had dammed off the small inflow and outflow creeks to create a small stagnant pond, teeming with all sorts of aquatic flora and fauna.
In order to apply some of our new GIS skills, my research partner, Amanda Armstrong (UW Biology), and I decided we would use this pond for a project. We would come to the pond, record the pH at various points, and map the values on GIS.
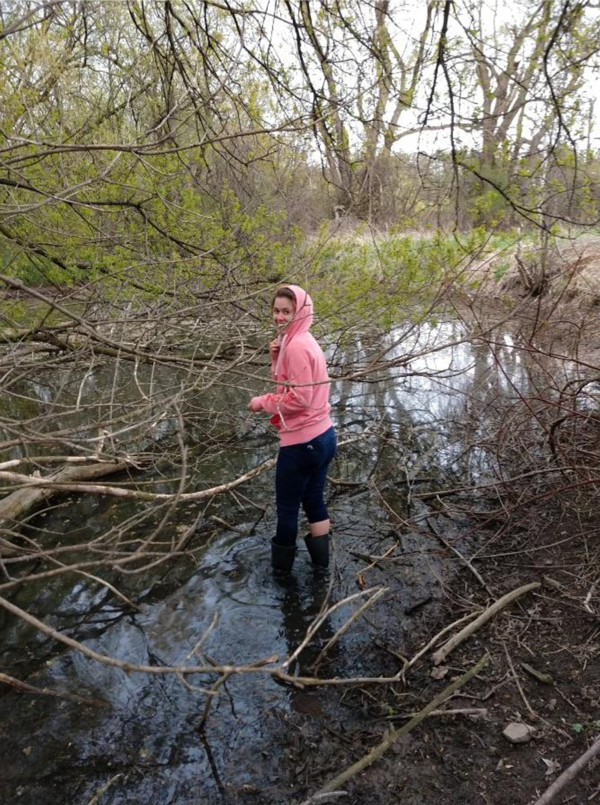
Ms. Armstrong taking a reading at the pond
We used a Root Farm pH testing kit. We put in 4 drops of the testing solution for every trial. We took readings all around the pond but were limited by depth. To record the locations of our trials, we used a GPS coordinates mobile app and took down the points of each trial. Because the pond is smaller and lesser-known, it does not show up on QGIS’s OpenStreetMap, nor on Google Maps. Therefore, we took some points to illustrate the edge of the pond as well. Below is a map of our readings (orange) on a map of the pond (gray).
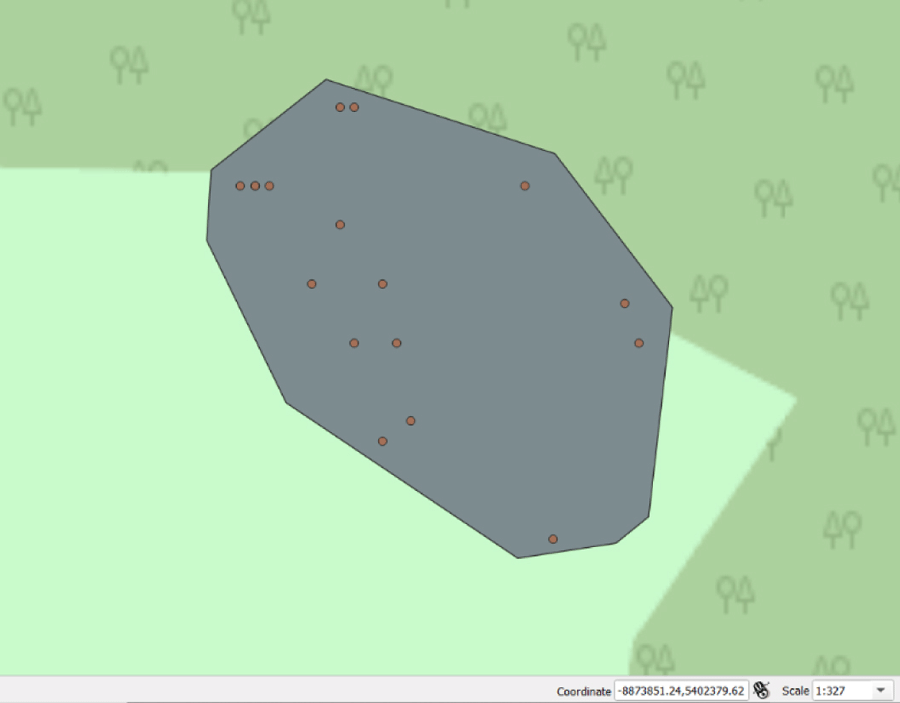
pH readings mapped on top of the pond
Because the GPS coordinates app we used only offered the coordinates in Lat/Long or N/E, I used a Python script to edit our Excel files and convert the points to EPSG:3857 coordinates so they would be accurately placed on our map. Below is the script.
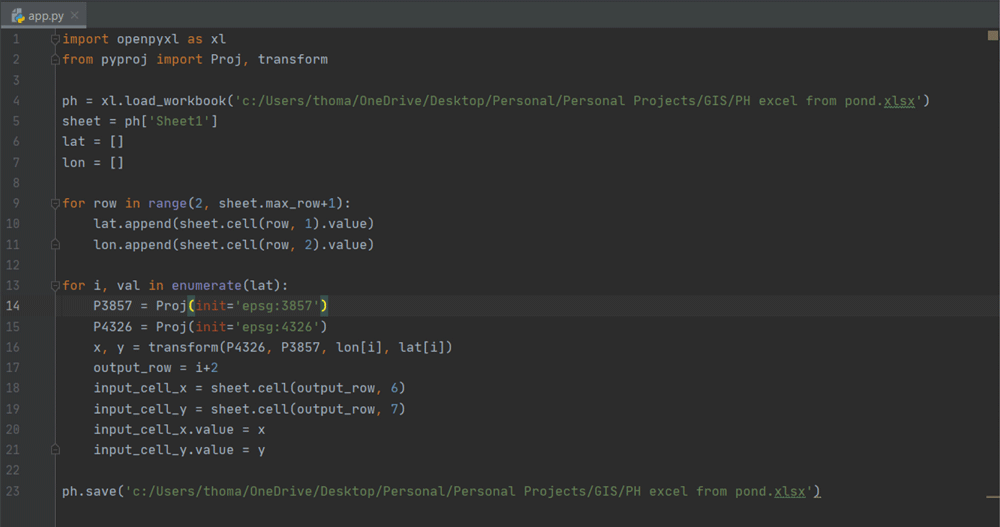
Python script used to convert from Lat/Long to EPSG:3857 coordinates.
The script opens an excel sheet it is given, reads all the rows in the first and second columns (except for their title cells), transforms the points in those columns, and prints them on the sixth and seventh columns of the sheet. Below are shown the results on the excel spreadsheet.
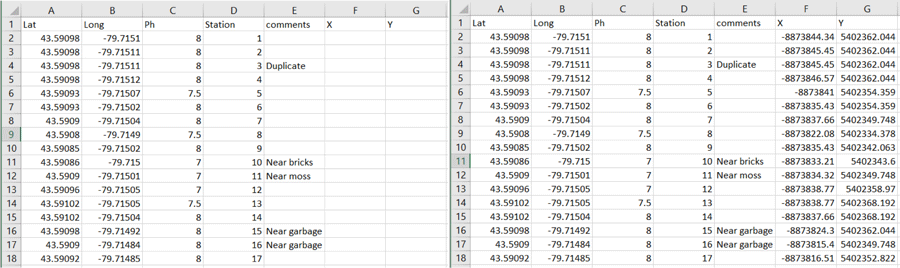
The script takes in latitudes and longitudes and outputs X, Y coordinates
Once our points were properly converted, we saved our Excel files as .CSV files, and imported them into QGIS. Next, to make a gradient map of the pH readings in the pond, we used the IDW (Inverse Distance Weighted) Interpolation method, using the pH values given in our .CSV file. Finally, we used the outline of the pond to form a masking layer and clipped the IDW map to fit the shape of the pond. We each added some features to our layout and produced the below final product.
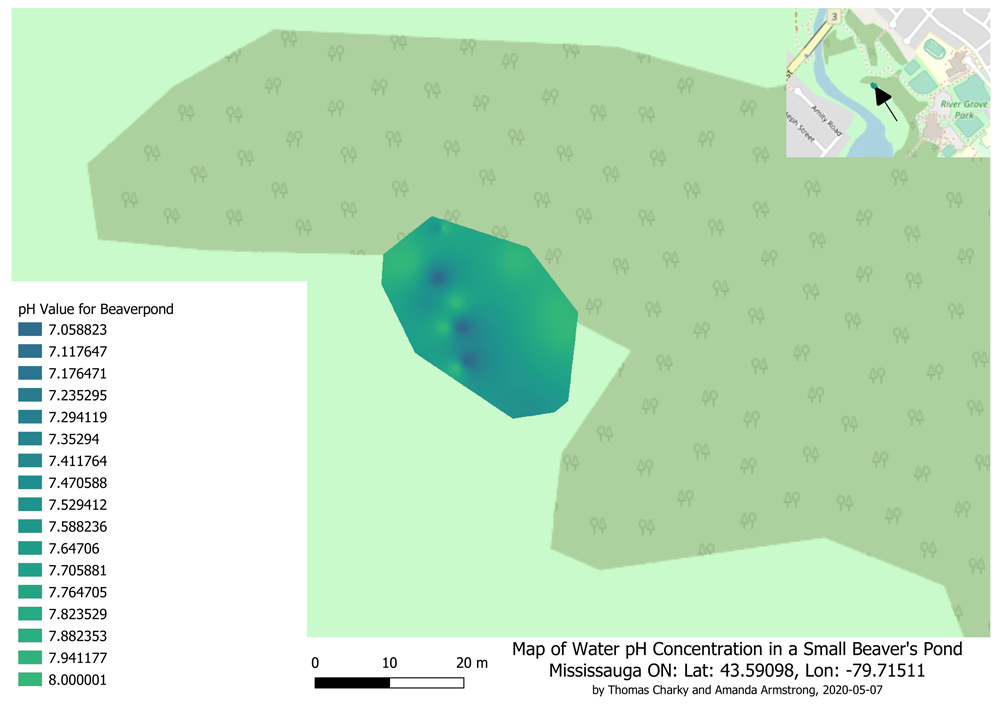
Final product depicting the pH values of the pond with a title block, legend, and location